| Chapter 18. Execution | ||
|---|---|---|
 | Part III. The eCos Configuration Tool |  |
Chapter 18. Execution
Table of Contents
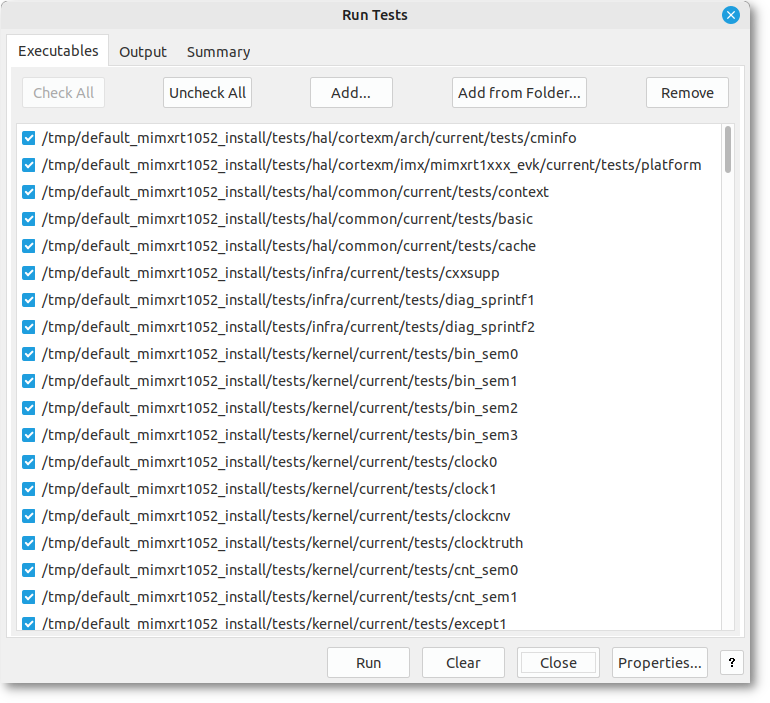
Test executables that have been linked using the Build/Tests operation against the current configuration can be executed by selecting → (Ctrl+F5) which will result in the dialog illustrated in Figure 18.1, “Run tests” being shown.
When this dialog is active, the Configuration Tool looks for a platform name corresponding to the currently loaded hardware template. If no such platform is found, a dialog will be displayed for you to define one; this dialog is similar to that displayed by the Add function in the → dialog, but in this case the platform name cannot be changed.
Figure 18.1. Run tests
![[Note]](pix/note.png) | Note |
|---|---|
This dialog resizable. |
This dialog comprises of three tabs: Executables, Output and Summary.
Four buttons appear on the dialog itself: Run/Stop, Clear, Close and Properties.
The Run button is used to initiate a test run. Those tests selected on the Executables tab are run, and the output recorded on the Output and Summary tabs. During the course of a run, the Run button changes to Stop and the Clear and Properties buttons are disabled. The Stop button may be used to interrupt a test run at any point. While tests are running, and after any test run, the status bar to the left of the Run/Stop button will contain the total tests executed as well as the totals of each test result.
The Clear button is used to clear the output recorded on the Output and Summary tabs, as well as the status bar.
The Close button is used to close the dialog.
The Properties button is used to open the eCos Configuration Tool Settings dialog as described in the next section.
18.1. Properties
The Properties button is used to change the connectivity properties for the test run and when pressed will bring up the dialog illustrated in Figure 18.2, “Run Tests Properties dialog box”.
Figure 18.2. Run Tests Properties dialog box
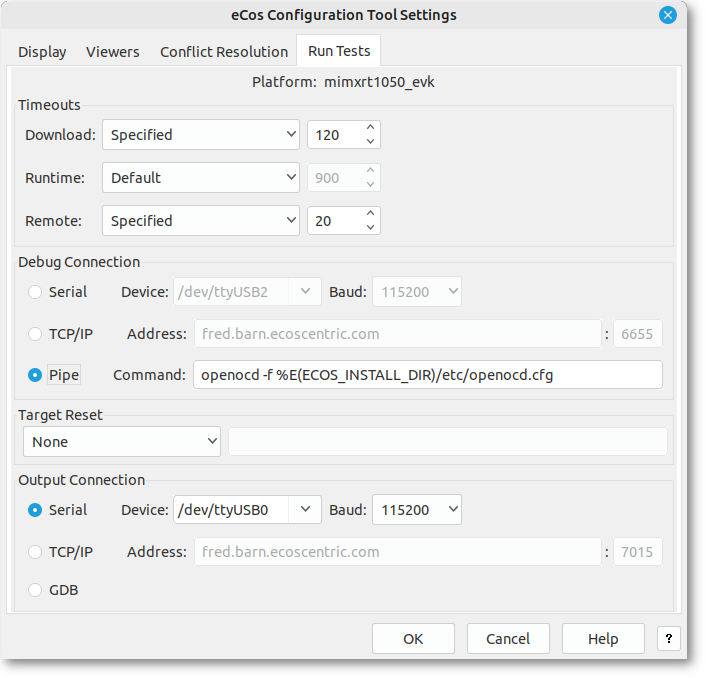
18.1.1. Download Timeout
This group of controls serves to set the maximum time that is allowed for downloading a test to the target board. If the time is exceeded, the test will be deemed to have failed for reason of “Download Timeout” and the execution of that particular test will be abandoned. This option only applies to tests run on hardware, not to those executed in a simulator. Times are in units of elapsed seconds.
Three options are available using the drop-down list:
Calculated from file size - an estimate of the maximum time required for download is made using the (stripped) executable size and the currently used baud rate
Specified - a user-specified value may be entered in the adjacent edit box
None - no maximum download time is to be applied.
18.1.2. Run time Timeout
This group of controls serves to set the maximum time that is allowed for executing a test on the target board or in a simulator. If the time is exceeded, the test will be deemed to have failed for reason of “Timeout” and the execution of that particular test will be abandoned. In the case of hardware, the time is measured in elapsed seconds: in the case of a simulator it is in CPU seconds.
Three options are available using the drop-down list:
None - no maximum download time is to be applied.
Specified - a user-specified value may be entered in the adjacent edit box
Default - a default value of 30 seconds is used
18.1.3. Debug Connection
The Debug Connection control is used to specify how the target board is to be accessed.
If the target board is connected using a serial cable, the
Serial radio button should be checked. In this case
you can select a port (On Windows COM1, COM2, … or on Linux
specify the path to the serial device /dev/ttyUSB0,
/dev/ttyS0) and an appropriate baud rate using
drop-list boxes.
If the target board is accessed remotely using GDB remote protocol, the “TCP/IP” radio button should be checked. In this case you can select a valid host name or IP address and TCP/IP port number using edit boxes.
If the target board is accessed remotely using a command PIPE, the “Pipe” radio button should be checked and the command, including arguments, entered into the corresponding Command field. Do not include the Pipe “|” symbol in the Command - this is added by the eCos Configuration Tool.
18.1.4. Target Reset
The Target Reset control is used to specify how the target board is to be made ready (reset) before each test execution.
Three options are available using the drop-down list:
- None
The test may be executed on the target hardware immediately, no hardware reset is required. For example, on a simulator or when the board is connected to a hardware debugger that resets or programs the target according to its configuration when a GDB client connects to it.
When using a Pipe command to openocd, openocd normally will reset and bring up the hardware in accordance with its scripts before accepting GDB commands from the Pipe. Similarly establishing a remote TCP/IP connection to a JTAG debugger such as the Ronetix PEEDI will normally configure and reset the hardware accordingly.
- Command
Target hardware can be reset through the local host execution of a command or script. You will be required to provide the command, complete with arguments, in the field alongside. Do not include the pipe (“|”) symbol. If the command is not on the path, the full path to the command must be entered. The command must also terminate with a zero exit code once the target hardware has been successfully reset. A non-zero exit code indicates the target as having failed and all following test executions are cancelled.
All output from the command will be displayed in the Output tab of the Run dialog.
- Manual
The target requires manual or physical intervention (such as a power cycle or pressing the reset button). The user is directed through a dialog Window to reset the target hardware and press OK when the target hardware is ready to execute a test or Cancel to terminate the execution of the selected tests.
18.1.5. Output Connection
The Output Connection control is used to specify where any output of tests may be accessed:
- GDB
This is the default and is typically used when tests are loaded and executed from RAM via a debug monitor such as RedBoot. This option may also be used with hardware debuggers when eCos isconfigured with the
CYGFUN_HAL_DIAG_VIA_GDB_FILEIOandCYGFUN_HAL_GDB_FILEIOconfiguration options enabled.However, this method of extracting output is invasive as the target will cease test execution temporarily, either through the monitor or the hardware debugger, while the output is extracted through GDB to the host. In addition, when the target is configured with SMP, RedBoot-based debugging is currently not supported.
- Serial
Select this radio button and choose the serial port on the host, along with the baud rate, on which diagnostic output from the target running eCos can be received. All data received on this port will appear in the Output tab described in Section 18.3, “Output Tab” and be interpreted as test output.
Many ARM target platforms include a Communication Device Class (CDC) USB Device using the sub-class Abstract Control Model (ACM). This enables input/output between the target and an external host to be configured in eCos through the USB-Serial connection. In addition, other targets include connectors for TTL to USB Serial converters to be attached, also providing a channel for input/output functionality between the target and an external host.
eCos supports configuring diagnostic output, such as test results, to be sent over a USB-Serial connection to a host. For example, the eCos configuration option
CYGHWR_HAL_CORTEXM_DIAGNOSTICS_INTERFACEis available on certain targets to allow you to specify where diagnostic output is to be sent.- TCP/IP
Select this radio button and choose the host name or IPv4 address, as well as the port number, on which diagnostic output from the target running eCos can be received. All data received on this port will appear in the Output tab described in Section 18.3, “Output Tab” and be interpreted as test output.
This feature is especially useful for accessing remotely located target hardware over a network where the target is providing diagnostic output over a serial port attached to either a terminal server such as the IOLAN+ Terminal Servers, or the target is connected to a remote host which provices access to its serial port through Linux applications such as ser2net or Windows applications such as realterm or TCP-Com.
18.2. Executables Tab
This is used to adjust the set of tests available for execution. A check box against each executable name indicates whether that executable will be included when the Run button is pressed. The Check All and Uncheck All buttons may be used to check or uncheck all items. Items may also be individually checked or unchecked.
When the dialog is first displayed, it will be pre-populated with those test executables that have been linked using the Build/Tests operation against the current configuration.
Figure 18.3. Run tests
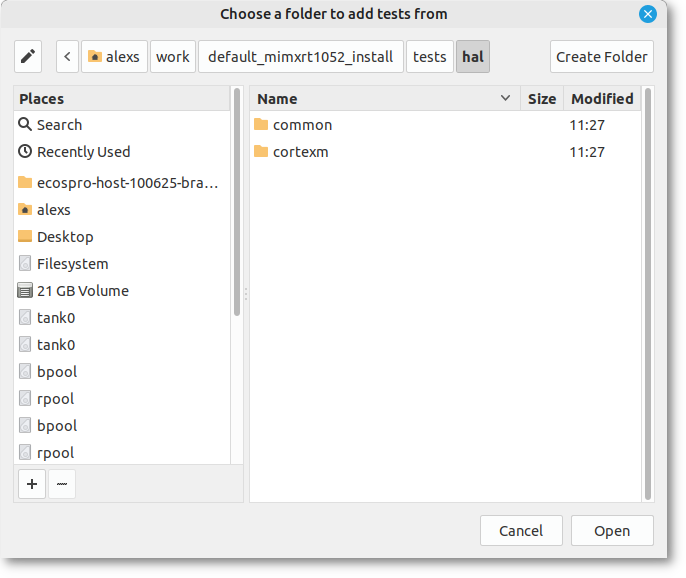
Highlighting items in the list and clicking the Remove button will remove those executables highlighted. Clicking the Add button will display a dialog box that allows you to add to the set of items. Equivalently the Add from folder.. button may be used to add add a number of executables in a specified folder (optionally including subfolders, if you click on Yes when asked).
Figure 18.4. Add files from folder
18.3. Output Tab
This tab is used to display the output from running tests. The output can be selected and copied by means of the popup menu displayed when you right-click in the window. The output is enriched to style test names as headings to aid with identification of individual test output and test result informational messages are highlighted in different colors.
Figure 18.5. Output Tab
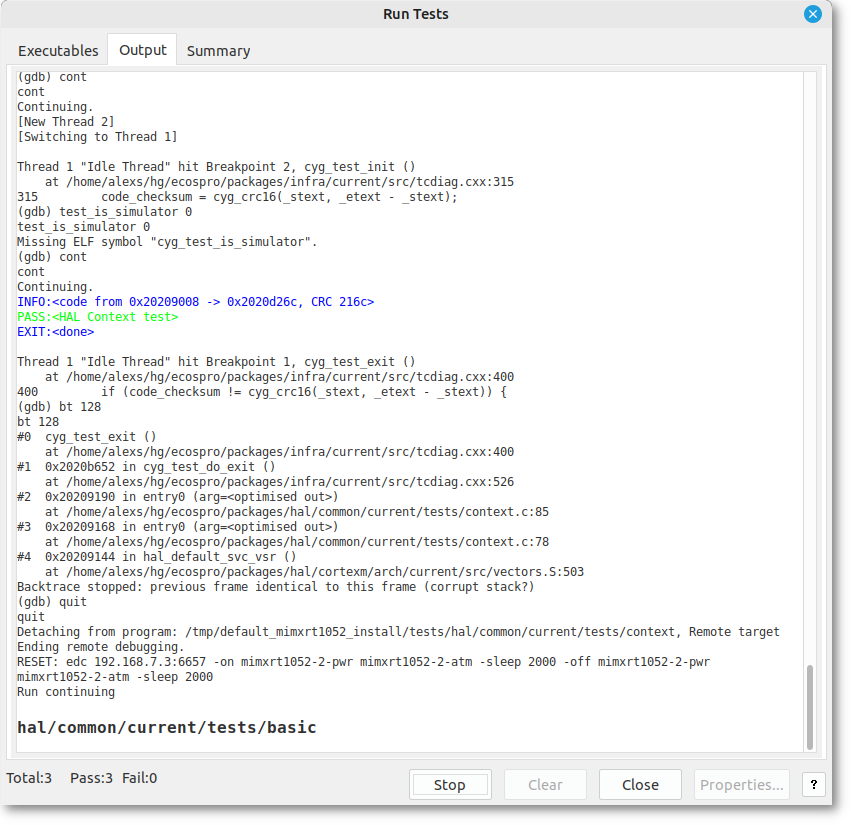
The output text window will follow new output as it is appended to the text window, and the test result totals in the status bar will be updated as tests are completed. When all the tests have completed execution, or execution of the tests is halted through the Stop button, the test result totals are appended to the output.
18.4. Summary Tab
This tab is used to display a record, in summary form, of those tests executed and is illustrated in Figure 18.6, “Summary Tab”.
Figure 18.6. Summary Tab
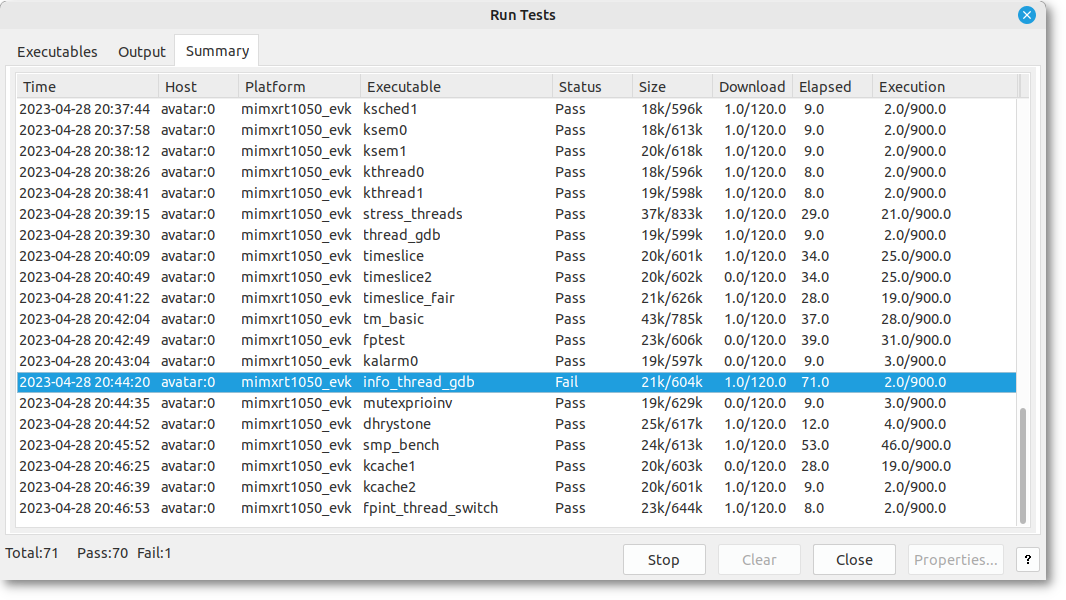
For each execution, the following information is displayed:
Time - the date and time of execution
Host - the host name of the machine from which the test was downloaded
Platform - the platform on which the test was executed
Executable - the executable (file name) of the test executed
Status - the result of executing the test. This will be one of the following:
Not started
No result
Inapplicable
Pass
DTimeout
Timeout
Cancelled
Fail
Assert fail
Size - the size [stripped/unstripped] of the test executed
Download - the download time [mm:ss/mm:ss] used. The first of the two times displayed represents the actual time used: the second the limit time.
Elapsed - the elapsed time [mm:ss] used.
Execution - the execution time [mm:ss/mm:ss] used. The first of the two times displayed represents the actual time used: the second the limit time.
Double-clicking on a test result, or selecting the test result
and pressing ENTER, will result in the dialog
switching to the Output tab and position the
output text to the start of that test.
Selecting a header will result in the test results being sorted in ascending order by the field values in that column.
| Note |
|---|---|
New test results will always appear at the bottom of the list, causing the list to be out of order after it has been sorted. Resorting the list will restore the order. |
| |  | |
| Chapter 17. Building |  | Chapter 19. Creating a Shell |
| 2025-10-02 | Open Publication License |