| Chapter 7. GProf Profile Plugin Support | ||
|---|---|---|
 |  | |
Chapter 7. GProf Profile Plugin Support
Table of Contents
- 7.1. GProf Profile Plugin Installation
- 7.2. The eCosPro Runtime profile statistics package
- 7.3. Enabling profiling data generation within eCos and the eCosPro application
- 7.4. Enabling and Disabling profiling data collection
- 7.5. Extracting and Clearing the profiling data from the target
- 7.6. Display the profiling data using the GProf plugin
The Linux Tools GProf plugin brings the profiling capabilities of the GNU profiler, gprof, to Eclipse, in a manner that is easy to use by developers with different levels of experience. eCos and eCosPro have the ability to generate the data used in the generation of gprof profile timing and call graphs (for additional information, please refer to the Profiling section of the eCos and eCosPro Reference Manual). The eCosPro CDT plug-in includes functionality to extract the data from an eCosPro application that is running, or has been halted on the target hardware, through the Eclipse GUI and provides as input this data to the Linux Tools GProf plugin.
This section describes how to bring all the above functionality together to permit you to graphically view and explore the target hardware application's profile and timing data on your development host. This will allow you to analyse and explore your code within the Eclipse GUI to determine not only the parts of your application which are slower in execution than expected, but also can help you find many other statistics through which potential bugs can discovered and resolved. This section also provides a walk-through of the installation of the Linux Tools GProf plugin, the configuration of eCosPro and creation and compilation of the eCosPro C/C++ Application Project such that profiling data is generated, through to the capture and display of the profiling data.
![[Note]](pix/note.png) | Note |
|---|---|
GProf Profile support is not available on all target platforms. It
requires an implementation of the profiling timer, there should be a
hardware- specific implementation of |
7.1. GProf Profile Plugin Installation
The current Eclipse distribution provided with the eCosPro Developer's Kit version 4.x and above includes the Linux Tools GProf plugin pre-installed. If you are using an earlier version of Eclipse or a distribution from a different source, you can follow the instructions in this section to install the Linux Tools GProf plugin.
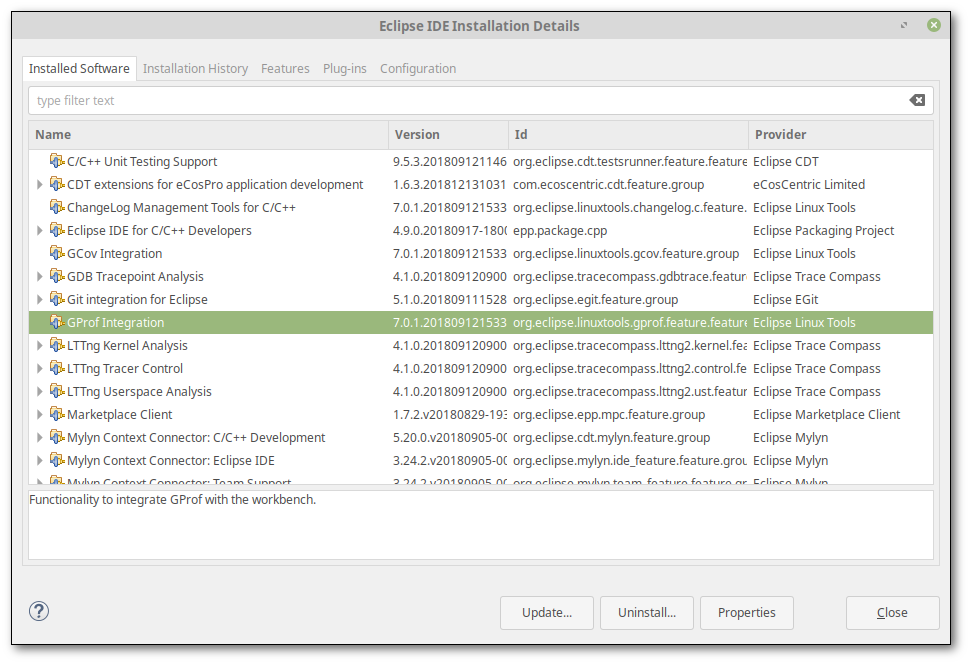
7.1.1. Check if Linux Tools GProf plugin is installed
To check whether the Linux Tools GProf plugin
is installed, within Eclipse select from the menu
→
and press the button. Within
the resulting dialog illustrated in
Figure 7.1, “Eclipse Installation Details - GProf” look in the
Configuration contents: section for
“GProf Integration”. If present, the plugin
is installed.
Figure 7.1. Eclipse Installation Details - GProf
7.1.2. Install Linux Tools GProf plugin
To install the Linux Tools GProf plugin
is installed you will need internet access. Within Eclipse select from the menu
→
and within the Work with: field of the resulting
dialog, enter the name of your Eclipse Installation and choose the
download URL. An example illustration of the dialog is shown in
Figure 7.2, “Eclipse Install GProf”.
For example,
“2018-09 - http://download.eclipse.org/releases/2018-09”.
Figure 7.2. Eclipse Install GProf
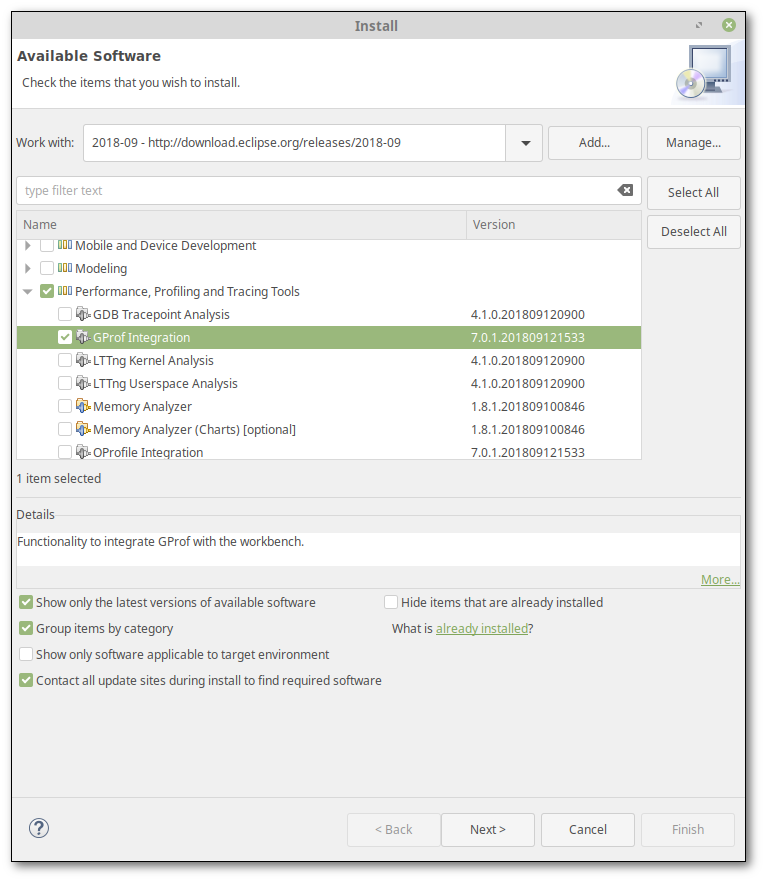
Select → and ensure the latter is checked. Select the button to confirm the install details followed by to confirm your acceptance of the license terms by selecting I accept the terms of the license agreement. Select the button to confirm agreement and begin the installation process. On completion of the installation you will be required to restart Eclipse.
7.2. The eCosPro Runtime profile statistics package
Runtime support is required from the operating system in order to create
and store the profiling data on the target platform and may easily be
added by including the Application profile support
package, also known as CYGPKG_PROFILE_GPROF, into your
eCos configuration. This may be achieved through one of two methods:
7.2.1. Adding CYGPKG_PROFILE_GPROF with the eCos Configuration Tool
Open up your eCos configuration within the eCos Configuration
Tool and select
→ (Ctrl+P) and type gprof into the
Keywords field as illustrated in
Figure 7.3, “Configuration Tool Install GProf Package”.
Figure 7.3. Configuration Tool Install GProf Package
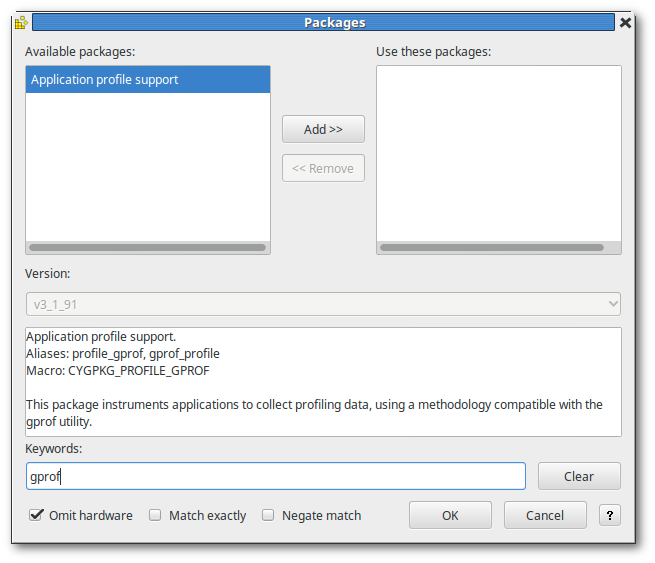
If already installed, the package Application profile
support will appear in the right-hand column under
Use these packages. If not installed, it will
appear under the Available Packages column. In
this case select the button to move the
package to the right-hand column followed by selecting the
button to accept the addition of the
package. Finally select
→ (Ctrl+S) to save your configuration followed optionally by
→ (F7) to rebuild the eCos library. The latter step is
optional as Eclipse will rebuild the library as soon as you exit
the eCos Configuration Tool if it
detects a change in the active configuration file.
7.2.2. Adding CYGPKG_PROFILE_GPROF with the command line
Open a command shell with the appropriate environment variables
set and, assuming your eCos configuration is named
ecos.ecc, the commands illustrated in
Example 7.1, “Adding CYGPKG_PROFILE_GPROF with the command line” will add the
CYGPKG_PROFILE_GPROF package and rebuild the
eCos library.
Example 7.1. Adding CYGPKG_PROFILE_GPROF with the command line
$ecosconfig add CYGPKG_PROFILE_GPROF$ecosconfig tree$make
7.2.3. Enabling TFTP support for profiling data extraction
Normally the capture of profiling data from the target platform requires the temporary suspension of all code execution on the target platform while the data is extracted, either through the use of a GDB monitor or a hardware debugger.
However, if your eCos Configuration includes the FredBSD networking
stack (the CYGPKG_NET_FREEBSD_STACK package) with the
TFTP server option enabled (the default), the profiling data may be
extracted from the target platform without temporarily suspending all
code execution. This is achieved through the use of an additional low-
priority eCos thread that provides a TFTP service (on port 69, the
default) which allows the transfer of the profiling data from the
target hardware to occur over TFTP. The eCos
CYGPKG_PROFILE_GPROF package by default creates this
thread when the CYGPKG_NET_FREEBSD_STACK package is
enabled.
When capturing profiling data in this manner, the eCosPro CDT plug-in needs to be configured where the profiling data will be captured from, otherwise the default method through GDB is used. Open the debug launch configuration window you previously created to launch the binary in Section 4.1, “eCos Launch Configurations” and select the Profiling tab. This dialog is illustrated in Figure 7.4, “Profiling Data Capture through TFTP”.
Figure 7.4. Profiling Data Capture through TFTP
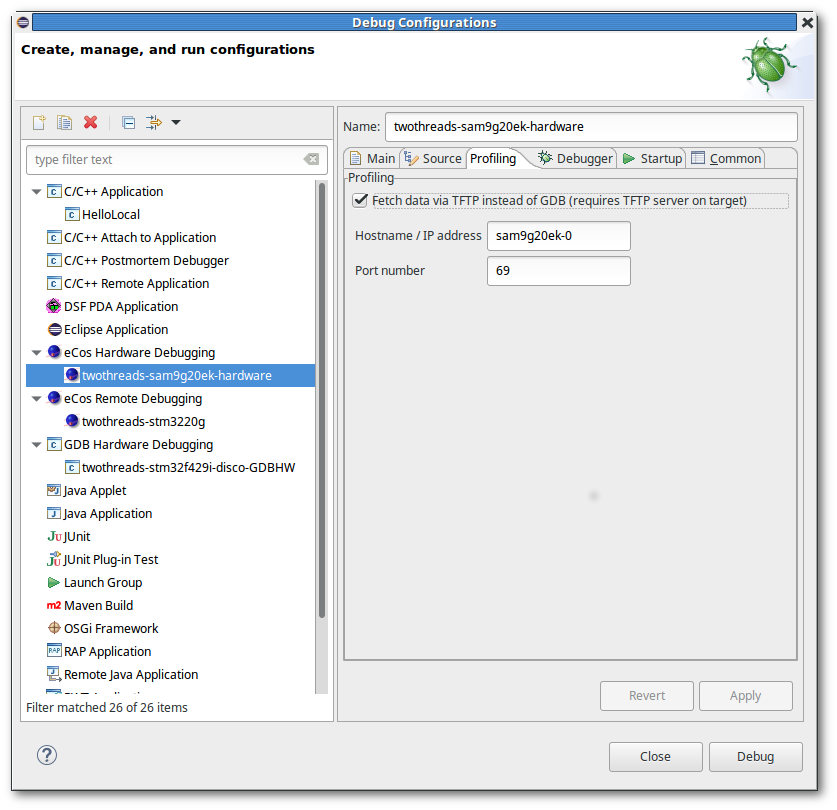
Check the Fetch data via TFTP instad of GDB (requires TFTP
server on target) field and fill in appropriate values for
the Hostname / IP address for the target
platform's network address and Port number. The
default port number set by the
CYGPKG_NET_FREEBSD_STACK package for the TFTP server
is 69.
7.3. Enabling profiling data generation within eCos and the eCosPro application
The generation of profiling data does not happen automatically when the
CYGPKG_NET_FREEBSD_STACK package is added to eCos.
The inclusion of this package within your eCos configuration just
enables runtime support. Code has to be compiled with the
-pg GNU compiler flag to make it capable of generating
profiling data.
7.3.1. Compiling the application with the -pg GNU compiler flag
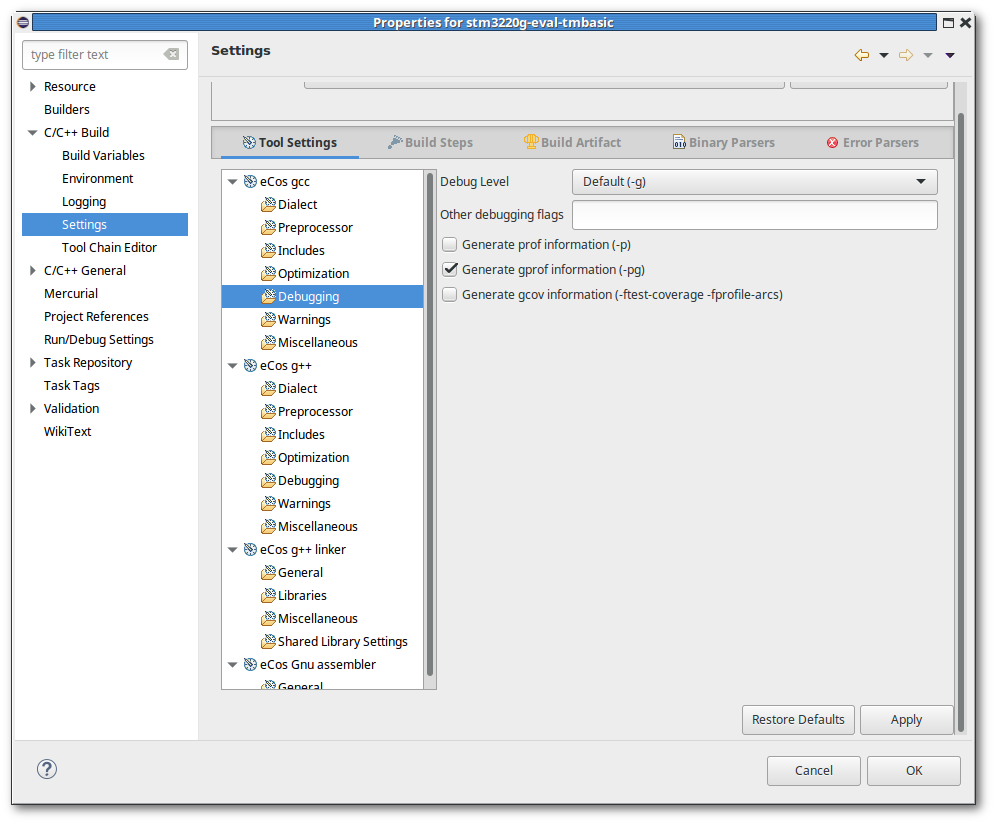
You may enable this flag project-wide by bringing up the project's properties dialog as described in Section 5.3, “Application Project Properties”, and selecting → , selecting the Tool Settings tab in the right-hand panel and within tree of settings selecting either → or → whether you wish profiling data to be generated for either C or C++ code, or both. Check the Generate gprof information (-pg) field from the right-hand panel, apply the changes and close the dialog by pressing the and buttons respectively. This is illustrated in Figure 7.5, “Enable Application Profiling Data Generation”.
Figure 7.5. Enable Application Profiling Data Generation
The -pg GNU compiler flag may also be enabled or
disabled for individual source files by opening the properties dialog
for each source file (similar to opening the application project's
properties, but start by highlighting the source file within the
window of the C/C++ perspective)
and checking or unchecking the Generate gprof information
(-pg) field.
7.3.2.
Compiling eCos with the -pg GNU compiler flag
eCos and eCosPro functions may also be included for profiling
data generation and analysis. This may be acheived by adding the
-pg GNU compiler flag to the value of
CYGBLD_GLOBAL_CFLAGS configuration macro.
To add or remove the flag, open the eCos configuration in the
eCos Configuraion Tool as described in Section 6.2.1, “Editing the eCos configuration project”, and search using the
Find in configuration dialog,
reached through the menu options
→ (Ctrl+F) for CYGBLD_GLOBAL_CFLAGS
(as Find what) with
Search in set to Macro
Names. Once visible,
mouse click in the value field (or
click to bring up a
String Edit dialog) and add or remove
the -pg flag to/from the value as required.
Finally select → (Ctrl+S) to save your configuration followed optionally by → (F7) to rebuild the eCos library.
7.4. Enabling and Disabling profiling data collection
Enabling and disabling the collection of profiling data is done
programatically by the application through the following two
functions: profile_on and
profile_off.
7.4.1. Enable profiling data collection
The application must call the function profile_on
to start the collection of profiling data. If the TFTP daemon is
enabled, the call to profile_on must happen once
the network is up and running, typically after the call to
init_all_network_interfaces. This is because the
TFTP daemon will be started within profile_on.
| Note |
|---|---|
|
A typical example is illustrated in Example 7.2, “Enable profiling data collection”.
Example 7.2. Enable profiling data collection
#include <pkgconf/system.h>
#ifdef CYGPKG_NET
# include <network.h>
#endif
#ifdef CYGPKG_PROFILE_GPROF
# include <cyg/profile/profile.h>
#endif
…
int
main(int argc, char** argv)
{
    …
#ifdef CYGPKG_NET
    init_all_network_interfaces();
#endif
    …

#ifdef CYGPKG_PROFILE_GPROF
    {
        extern char _stext[], _etext[];
        profile_on(_stext, _etext, 16, 3500);
    }
#endif
    …
}
The profile_on function takes four arguments:
start address,end addressThese two arguments specify a range of addresses that are to be profiled in a contiguous section of memory. The eCos linker script export the symbols
_stextand_etexton most targets and these correspond to the beginning and end of code. Profiling may be performed on a subset of code by specifying the start and end addresses of the code region on which profiling is to be performed.bucket sizeThis is the bucket size which the
profile_ondivides the range of addresses into. It dynamically allocates a single array of 16-bit counters with one entry for each bucket. When the profiling timer interrupts, the interrupt handler will examine the program counter of the interrupted code and, assuming it is within the range of valid addresses, find the containing bucket and increment the appropriate counter.Notes The number of 16-bit counters is determined by the range of addresses being profiled and by the bucket size. Smaller bucket sizes and large memory ranges will require more memory, so if the target hardware is low on memory this may be unacceptable. The memory requirements can be reduced by reducing the code range or increasing the bucket size. The latter increase will affect the accuracy of the results, making gprof more likely to report the wrong function and increasing the risk of a counter overflow.
The bucket size must be a power of 2 and will be adjusted if necessary. This is done for the sake of run-time efficiency.
time intervalThis specifies, in units of microseconds, the interval between profile timer interrupts. Increasing this value gives more accurate profiling results but will result in higher run-time overheads and a greater risk of a counter overflow. This value may be modified by the implementation because of hardware restrictions, so as a result the generated profile data contains the actual interval used.
![[Tip]](pix/tip.png)
Tip Avoid using an interval that is a simple fraction of the system clock, typically 10000 microseconds, as use of such intervals runs the risk that the profiling timer will disproportionally sample code that runs only in response to the system clock.
7.4.2. Disabling profiling data collection
The collection of profiling data may be disabled by the
application, using a call to profile_off.
This will also reset any existing profile data.
The function prototype is illustrated in
Example 7.3, “profile_off prototype”.
Example 7.3. profile_off prototype
void profile_off(void);
7.5. Extracting and Clearing the profiling data from the target
Extracting and clearing the profiling data from the target platform is a
simple operation with eCosPro and the eCosPro CDT plug-in. When eCosPro is
configured and built as described in
Section 7.2.1, “Adding CYGPKG_PROFILE_GPROF with the eCos Configuration Tool”, the series of macros
required to extract and clear the profiling data from the target
platform eCos are installed in a file within the ${eCosInstallDir}/etc directory. When
required, these macros are loaded by the eCosPro CDT plug-in into
GDB and executed.
Also ensure that you have included the code described in Section 7.4.1, “Enable profiling data collection” into your application, configured the launch profile for TFTP if required as described in Section 7.2.3, “Enabling TFTP support for profiling data extraction”, and start executing and debugging your application in the normal fashion.
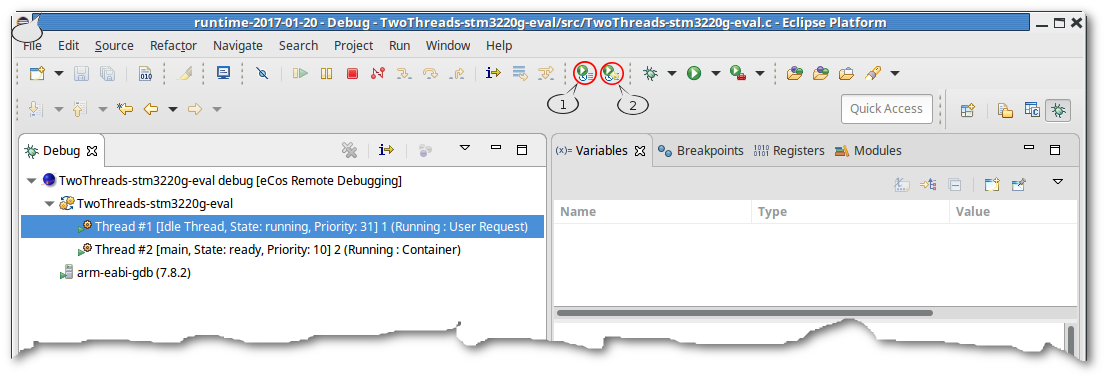
Figure 7.6. Capture and Clear Profiling Data
7.5.1. Extracting the profiling data from the target
To capture the profiling data, select the application's process or one of the application's threads within the Debug Window of the Debug Perspective, and press the Take Profile Snapshot button called out as 1 in Figure 7.6, “Capture and Clear Profiling Data”.
This will extract the profiling data from the target, pausing and
resuming execution if necessary, and save it to a file within the
project explorer tree in the same directory as the binary executable.
The file will have a .gmon extension with the
date and time of the snapshot as the base name, allowing multiple
snapshots to be taken and saved at different times.
| Note |
|---|---|
If you are using a software monitor (e.g. RedBoot) to debug your application and not a hardware debugger, and if the application is not already paused, the snapshot may not immediately be taken but may be delayed until the software monitor is active (e.g. when performing diagnostics output). This is also dependant on the eCos configuration. |
7.5.2. Clearing the profiling data from the target
To clear the profiling data, press the Reset Profile Data button called out as 2 in Figure 7.6, “Capture and Clear Profiling Data” when either the application's process or one of the application's threads within the Debug Window of the Debug Perspective is selected. Similar to the capturing of the data, this will pausie and resume execution of the application if necessary.
7.6. Display the profiling data using the GProf plugin
To display the profiling data in the GProf
plugin,
on the .gmon filename corresponding to the data capture
you would like to display, or
on the filename and select or
→ .
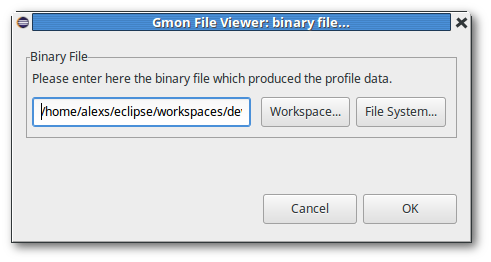
If you have multiple binaries, the popup illustrated in Figure 7.7, “Gmon File Viewer: select binary” will appear prompting you to
select the binary used to generate the profiling data. If prompted,
select the application binary used to generate the profile data.
Figure 7.7. Gmon File Viewer: select binary
Select the gprof tab as illustrated in Figure 7.8, “Gprof tab window”.
Figure 7.8. Gprof tab window
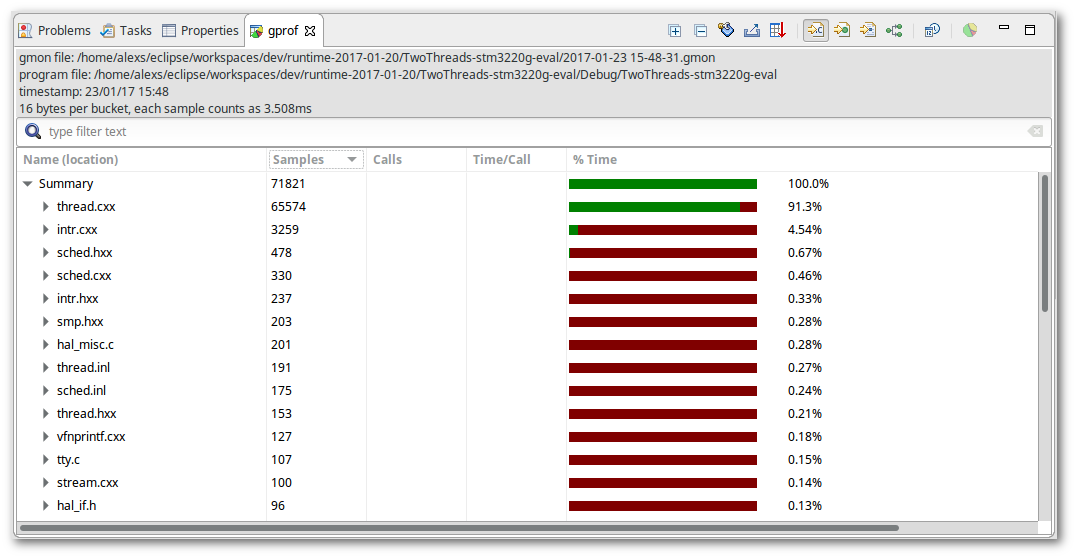
The Gprof view shows how much execution time is consumed by each part of the application and also provides call graph infomation for each function. The buttons available are:
 “Show/Hide columns” button allows you to select which
columns to display.
“Show/Hide columns” button allows you to select which
columns to display.
 “Export to CSV” button allows you to export the GProv result
as a CSV text file.
“Export to CSV” button allows you to export the GProv result
as a CSV text file.
 “Sorting” button allows you to choose the columns, their priority
and their ordering by which the data is sorted.
“Sorting” button allows you to choose the columns, their priority
and their ordering by which the data is sorted.
 “Sort samples per file” button displays the GProf result
sorted by file.
“Sort samples per file” button displays the GProf result
sorted by file.
 “Sort samples per function” button displays the GProf result
sorted by function.
“Sort samples per function” button displays the GProf result
sorted by function.
 “Sort samples per line” button displays the GProf result
sorted by line.
“Sort samples per line” button displays the GProf result
sorted by line.
 “Display function call graph” button displays the GProf result
as a call graph.
“Display function call graph” button displays the GProf result
as a call graph.
 “Switch sample/time” button allows you to switch the data
between sample and time results.
“Switch sample/time” button allows you to switch the data
between sample and time results.
 “Create chart” button allows you to create a chart (Bar/Vertical bar/Pie)
from the data selected for the data of selected columns.
“Create chart” button allows you to create a chart (Bar/Vertical bar/Pie)
from the data selected for the data of selected columns.
For further documentation, please refer to the GProf User Guide.
| | | |
| Chapter 6. About configuration projects |  | Chapter 8. Hints and Troubleshooting |
| 2020-11-03 | Legal Notice |